Replacing gut-feel marketing budgets with Linear Programming, Mixed-Integer Programming, and dynamic reinvestment models.
Every year, marketing teams sit in rooms and debate where the budget should go. TV or digital? Facebook or LinkedIn? Double down on SEO or shift to paid search?
Most of those debates are settled by opinion, precedent, or whoever argues loudest. I decided to settle them with math.
The Problem With How Marketing Budgets Get Made
Marketing platforms don’t all behave the same way. Some show diminishing returns — the more you spend, the less each additional dollar earns. Others have threshold effects — spending below a certain level produces almost nothing, but crossing that threshold unlocks real impact.
A simple spreadsheet can’t model this. Neither can gut instinct. What you need is an optimization framework that understands the shape of each platform’s return curve — and allocates accordingly.
That’s exactly what this project builds.
The Setup
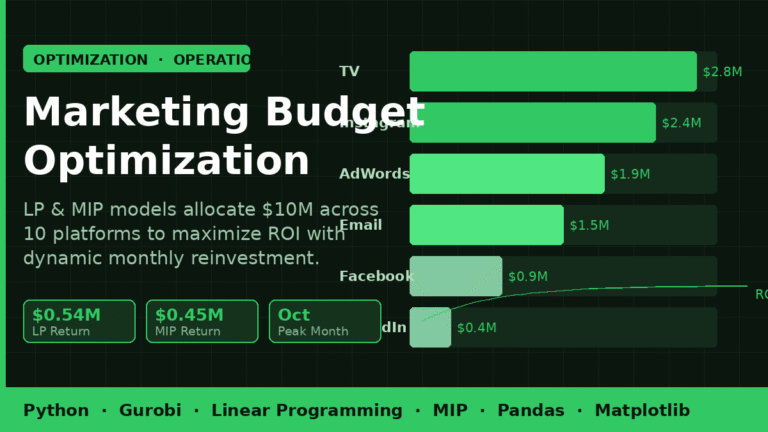
Budget: $10 million annually Platforms: 10 channels — TV, Print, Facebook, Instagram, LinkedIn, SEO, AdWords, Email, and more Goal: Maximize total ROI across all platforms while respecting real business constraints
The constraints aren’t arbitrary. They reflect how marketing actually operates:
- No single platform can absorb more than $3M (concentration risk)
- Traditional and digital media must maintain a minimum proportional balance
- A platform is only funded if spending exceeds its minimum effective threshold — no symbolic $50K allocations that produce zero impact
Two Datasets, Two Very Different Problems
Dataset 1: Concave ROI (Diminishing Returns)
Here, every platform showed smooth, predictable returns that peak early and taper off. This is the “well-behaved” scenario — and it’s perfectly suited for Linear Programming (LP).
LP found the optimal allocation efficiently: concentrate spending on the top performers (TV, Instagram, Email, AdWords) and don’t spread thin. The result was a $0.5436M return on the $10M budget.
The key insight from this model: diversification is suboptimal. The math consistently pushed money toward the best platforms until the $3M cap forced it to diversify. Without that cap, it would have allocated almost everything to two or three channels.
Dataset 2: Non-Concave ROI (Irregular Returns)
This is where things get interesting — and realistic. Some platforms showed ROI that jumps at certain spending levels, dips, then recovers. You can’t model this with LP because LP assumes smooth, predictable curves.
Enter Mixed-Integer Programming (MIP).
Binary decision variables “activate” specific spending tiers for each platform, with constraints ensuring only adjacent tiers can be selected (SOS2-style logic). This captures the true shape of irregular return curves.
The MIP model produced a more balanced allocation across Print, Facebook, AdWords, and LinkedIn — and returned $0.4528M. Lower than LP on paper, but far more honest about how these platforms actually behave.
The cost of using the wrong model? Applying LP to non-concave data lost hundreds of thousands of dollars in projected return. Model selection isn’t academic — it’s financial.
The Dynamic Layer: 12 Months of Reinvestment
Static annual optimization is useful. But marketing budgets aren’t static — returns from one month can fund the next.
The most advanced model extended this into a 12-month dynamic framework:
- Each month’s budget = base $10M + 50% of last month’s return
- Individual monthly models solved independently
- Monthly budgets ranged from $10M to $10.323M as returns compounded
Monthly returns across the year ranged from $0.42M (February) to $0.65M (October) — revealing clear seasonal patterns that a static annual model would completely miss.
The Stability Problem No One Talks About
Here’s something pure optimization gets wrong.
The mathematically optimal solution changes platform allocations dramatically month-to-month — sometimes by millions of dollars. In theory, this maximizes returns. In practice, no marketing team can execute this.
The analysis found 33 violations where monthly changes exceeded the $1M operational threshold. Shifting TV spend from $2.8M to $0.4M in a single month isn’t just inefficient — it’s contractually and operationally impossible.
The fix: stability constraints that cap month-over-month changes per platform. Yes, this slightly reduces theoretical ROI. No, it doesn’t matter, because the unconstrained version was never executable anyway.
Real optimization balances mathematical optimality with operational feasibility. The best model is the one your team can actually implement.
What the $3M Cap Reveals
Of all the constraints in the model, the $3M platform cap was the most consistently active — meaning the optimizer hit it repeatedly across scenarios.
This is telling. It means the model wants to concentrate even more heavily than $3M in top performers. Organizations that enforce arbitrary diversity mandates (“we must spend on at least 8 platforms”) are almost certainly leaving money on the table.
Data-driven concentration, bounded by a sensible cap, beats forced diversification every time.
Business Takeaways for Leadership
1. Concentrated spending outperforms “balanced” spending — unless business constraints force diversification, the math consistently consolidates into top performers.
2. Model type has direct financial consequences — using LP on non-concave data isn’t just technically wrong, it costs real money.
3. Threshold effects are real and should be built into planning — if you’re spending below a platform’s minimum effective level, you’re not building brand equity, you’re burning cash.
4. Dynamic reinvestment compounds gains — treating monthly returns as fuel for next month’s budget is a simple mechanism that meaningfully improves year-end ROI.
5. Stability constraints are not a weakness — they’re what makes an optimization model deployable rather than theoretical.
The Bigger Picture
This framework isn’t just for a $10M marketing budget. The same approach applies to media mix modeling at scale, multi-region campaign planning, or any resource allocation problem where returns vary non-linearly across options.
The goal was never to produce a number. It was to build a transparent, explainable, and executable decision tool that leadership can actually trust — and actually use.
That’s what optimization, done right, looks like.